Morocco living costs: why can monthly prices rise while annual prices fall?
The latest HCP release we reviewed covers August 2026. We explain its meaning and how to compare your city without mistaking an index for a product price.
The latest HCP release we reviewed covers August 2026. We explain its meaning and how to compare your city without mistaking an index for a product price.
The latest release we reviewed
HCP published its August 2026 release on 22 September. The consumer price index rose 0.8% from July but fell 0.3% from August a year earlier. These findings are compatible: one comparison is monthly and the other annual.
The comparison period matters
Imagine a hypothetical basket that cost MAD 1,000 a year ago. A 0.3% decrease would make it MAD 997 at the end of the period, assuming it followed the index exactly. A single month within that year could still have a price increase. One percentage does not describe every month's path or predict the shopping bill of a particular household.
The July release had recorded a 1.0% monthly decline. The change of direction between July and August shows why it is useful to follow several periods rather than treating a single month as a permanent trend.
Cities do not all move together
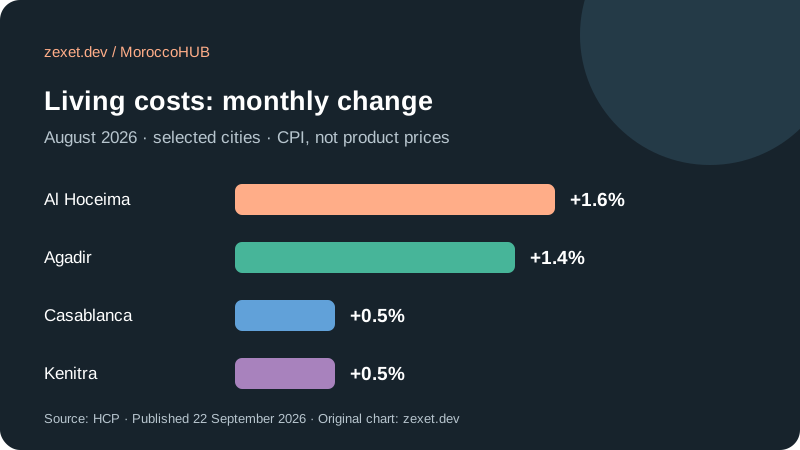
In August, the monthly increase was 1.6% in Al Hoceima and 1.4% in Agadir, compared with 0.5% in Casablanca and Kenitra. These figures compare changes in indices; they do not establish a fixed difference in shopping costs between cities.
The prices page lets you select a city and see its change where the official release provides an observation. Missing cities receive a missing-data message. We do not substitute a regional value or a nearby city's figure. An expandable comparison shows the 18 cities covered by this release.
What does CPI measure?
HCP describes a fixed basket containing 546 items and 1,391 varieties, with 2017 as the base year. The index measures relative changes rather than listing every product's price in every shop.
A household with a large transport budget may experience different changes from one spending a greater share on food. Applying the national percentage to every personal bill would not establish what each family actually paid. The index gives a comparison framework; personal expense tracking needs the quantities and prices on your own receipts.
Using the figures
- Check the observation period. August data is not a daily measurement for October.
- Compare months with months and years with years. A different reference period answers a different question.
- Use receipts and quantities to calculate your actual spending, and the index to understand the wider trend.
- Keep fuel observations in MAD separate from living-cost changes in percentages.
Updates on the platform
The platform checks HCP's listing for newer releases and displays the original observation period separately from the source check date. It does not relabel an old release as new statistical evidence. A newer verified release updates the displayed dataset. This article's analysis remains tied to its stated period and requires editorial review when new facts are added.
Sources
Sources
- Indice des prix à la consommation — août 2026 · Haut-Commissariat au Plan
- Indice des prix à la consommation — juillet 2026 · Haut-Commissariat au Plan
- Indice des prix à la consommation — définition · Haut-Commissariat au Plan